Big Data Analytics and Visualization
Why Big Data Analytics and Visualization is so important now than before?
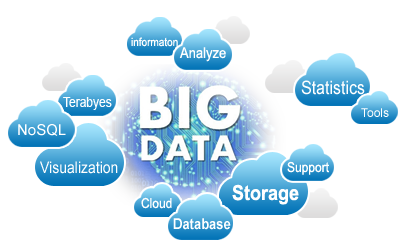
Big data is a popular term used to describe large, complex, and both structured and unstructured data.
Big data can be described by the following characteristics:
- By Volume - Many factors contribute to the increase in data volume. Structured data collected through relational database applications. Unstructured data streaming in from social media. Increasing amounts of sensor and machine-to-machine data being collected.
- By Variety - Data comes in all types of formats. Structured data in traditional databases. Information created from line-of-business applications. Unstructured text documents, email, video, audio, stock ticker data and financial transactions.
- By Velocity - The speed of generation of Data is ever increasing and must be dealt with in a timely manner.
- By Variability - In addition to the increasing velocities and varieties of data, data flows can be highly inconsistent with periodic peaks.
- By Veracity - The quality of the data being captured can vary greatly. Accuracy of analysis depends on the veracity of the source data.
- By Complexity - Today's data comes from multiple sources. And it is still an undertaking to link, match, cleanse and transform data across systems to be able to grasp the information that is supposed to be conveyed by this data quickly and efficiently.
Big data may be as important to business and society as the Internet has become. Why? More data may lead to more accurate analyses.
Twenty years ago, only the corporations had enormous data sets and the motivation were able to process them. Predominantly, the members of the scientific community. Even then, the results of data mining were impressive. They were able to solve significant scientific problems that were standing in the field for many decades.
The explosive growth of the Internet changed everything. The businesses found themselves operating online and enormous volumes of data about customers and their behavior. The economic motivations to invest in the field increased as the power of data mining became clearer. For an example, Netflix offered a $1 million prize to any team that could mine its information about users and build a more accurate recommendation system than the one it already had. High-profile examples like this only scratch the surface of the applications for data mining.
Businesses and industry are increasingly interested in leveraging the data they capture through business processes. In particular, health care, social media, and anything that takes place on the Web. Now, Internet giants make their money from the information they collect about users and the insights they gain from mining it. Retailers can access complex patterns of shopper behavior to help them stock their stores more profitably. Industry researchers can predict automobile traffic patterns based on congestion, weather, and time of year, and offer the best routes.
Greater advantages by combining big data and high-powered analytics and visualization tools. The following are some of the advantages:
- Determine root causes of failures, issues and defects in near-real time, potentially saving billions of dollars annually.
- Optimize routes for many thousands of package delivery vehicles while they are on the road.
- Analyze millions of SKUs to determine prices that maximize profit and clear inventory.
- Generate retail coupons at the point of sale based on the customer's current and past purchases.
- Send tailored recommendations to mobile devices while customers are in the right area to take advantage of offers.
- Recalculate entire risk portfolios in minutes.
- Quickly identify customers who matter the most.
- Use clickstream analysis and data mining to detect fraudulent behavior.
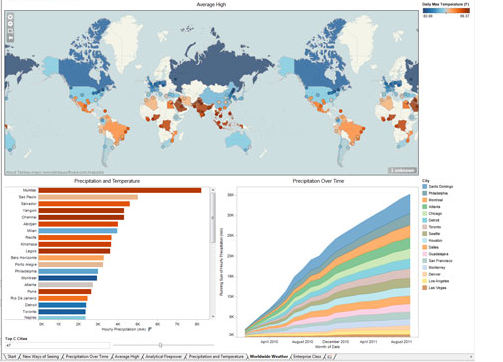
Data visualization refers to the techniques used in communicating data or information by using visual objects such as networks, charts, Stream graphs, Tree maps, Gantt Charts and Scatter Plots (3D). The goal is to communicate information clearly and efficiently to users. Here are a few top data visualization software: